Confusion Matrix...
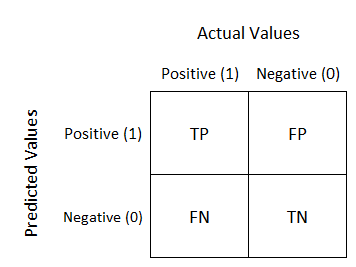
Confusion matrix , also known as an error matrix. A confusion matrix is a table that is often used to describe the performance of a classification model (or “classifier”) on a set of test data for which the true values are known. It allows the visualization of the performance of an algorithm. Most performance measures are computed from the confusion matrix.

Definition of the Terms:
1. Positive (P) : Observation is positive (for example: is an apple).
2. Negative (N) : Observation is not positive (for example: is not an apple).
3. True Positive (TP) : Observation is positive, and is predicted to be positive.
4. False Negative (FN) : Observation is positive, but is predicted negative.
5. True Negative (TN) : Observation is negative, and is predicted to be negative.
6. False Positive (FP) : Observation is negative, but is predicted positive.
It is extremely useful for measuring Recall, Precision, Specificity, Accuracy and most importantly AUC-ROC Curve .

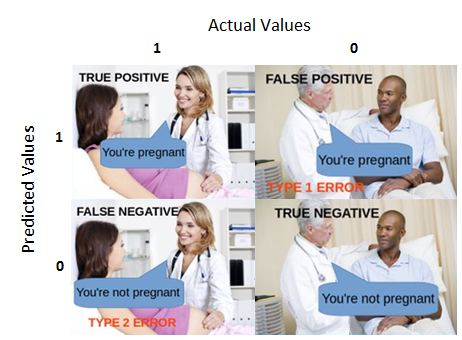
True Positive:
Interpretation: You predicted positive and it’s true.
You predicted that a woman is pregnant and she actually is.
True Negative:
Interpretation: You predicted negative and it’s true.
You predicted that a man is not pregnant and he actually is not.
False Positive: (Type 1 Error)
Interpretation: You predicted positive and it’s false.
You predicted that a man is pregnant but he actually is not.
False Negative: (Type 2 Error)
Interpretation: You predicted negative and it’s false.
You predicted that a woman is not pregnant but she actually is.
Just Remember, We describe predicted values as Positive and Negative and actual values as True and False.


High recall, low precision: This means that most of the positive examples are correctly recognized (low FN) but there are a lot of false positives.
Low recall, high precision: This shows that we miss a lot of positive examples (high FN) but those we predict as positive are indeed positive (low FP).
F-measure: Since we have two measures (Precision and Recall) it helps to have a measurement that represents both of them. We calculate an F-measure which uses Harmonic Mean in place of Arithmetic Mean as it punishes the extreme values more. The F-Measure will always be nearer to the smaller value of Precision or Recall.

Why you need Confusion matrix?
1. It shows how any classification model is confused when it makes predictions.
2. Confusion matrix not only gives you insight into the errors being made by your classifier but also types of errors that are being made.
3. This breakdown helps you to overcomes the limitation of using classification accuracy alone.
4. Every column of the confusion matrix represents the instances of that predicted class.
5. Each row of the confusion matrix represents the instances of the actual class.
6. It provides insight not only the errors which are made by a classifier but also errors that are being made.