ML Classification :
Classification is a process of categorizing a given set of data into classes, It can be performed on both structured
or unstructured data. The process starts with predicting the class of given data points. The classes are often referred
to as target, label or categories.
Heart disease detection can be identified as a classification problem, this is a binary classification since there
can be only two classes i.e has heart disease or does not have heart disease.
Since classification is a type of supervised learning, even the targets are also provided with the input data.
Classification Terminologies :
1. Classifier – It is an algorithm that is used to map the input data to a specific category.
2. Classification Model – The model predicts or draws a conclusion to the input data given for training, it will predict the
class or category for the data.
3. Feature – A feature is an individual measurable property of the phenomenon being observed.
4. Binary Classification – It is a type of classification with two outcomes, for eg – either true or false.
Binary classification is the simplest kind of machine learning problem. The goal of binary classification is to categorise data
points into one of two buckets: 0 or 1, true or false, to survive or not to survive, blue or no blue eyes, etc.
5. Multi-Class Classification – The classification with more than two classes, in multi-class classification each sample is
assigned to one and only one label or target.
6. Multi-label Classification – This is a type of classification where each sample is assigned to a set of labels or targets.
7. Train the Classifier – Each classifier in sci-kit learn uses the fit(X, y) method to fit the model for training the
train X and train label y.
8. Predict the Target – For an unlabeled observation X, the predict(X) method returns predicted label y.
9. Evaluate – This basically means the evaluation of the model i.e classification report, accuracy score, etc.
Multiclass Classification :
A classification task with more than two classes; e.g., classify a set of images of fruits which may be oranges,
apples, or pears. Multi-class classification makes the assumption that each sample is assigned to one and only one label:
a fruit can be either an apple or a pear but not both at the same time.
We generally use different multiclass classification methods such as KNN, Decision trees, SVM, etc.
In case of imbalanced datasets, confusion-matrix is good technique to summarizing the performance of a classification algorithm.
Confusion Matrix is a performance measurement for a classification algorithm where output can be two or more classes.
How to improve the performance ?
There are various techniques involved in improving the performance of imbalanced datasets.
Re-sampling Dataset :
To make our dataset balanced there are two ways to do so:
1. Under-sampling: Remove samples from over-represented classes ; use this if you have huge dataset.
2. Over-sampling: Add more samples from under-represented classes; use this if you have small dataset.
SMOTE (Synthetic Minority Over-sampling Technique) :
SMOTE is an over-sampling method. It creates synthetic samples of the minority class.
Precision-Recall Curves :
Precision-Recall is a useful measure of success of prediction when the classes are very imbalanced. Precision is a measure
of the ability of a classification model to identify only the relevant data points, while recall is a measure of the ability
of a model to find all the relevant cases within a dataset.
The precision-recall curve shows the trade-off between precision and recall for different threshold. A high area under
the curve represents both high recall and high precision, where high precision relates to a low false positive rate,
and high recall relates to a low false negative rate.
High scores for both precision and recall show that the classifier is returning accurate results (precision),
as well as returning a majority of all positive results (recall). An ideal system with high precision and high
recall will return many results, with all results labeled correctly.
Cross-validation :
Over-fitting is a common problem in machine learning which can occur in most models. k-fold cross-validation
can be conducted to verify that the model is not over-fitted. In this method, the data-set is randomly partitioned
into k mutually exclusive subsets, each approximately equal size and one is kept for testing while others are used
for training. This process is iterated throughout the whole k folds.
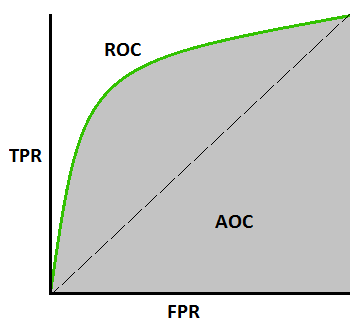
ROC curve ( Receiver Operating Characteristics) :
ROC curve is used for visual comparison of classification models which shows the trade-off between the true
positive rate and the false positive rate. The area under the ROC curve is a measure of the accuracy of the model,
the area under the curve (AUC) tells us that how well a parameter can distinguish between two diagnostic groups / classes.
Defining terms used in AUC and ROC Curve :
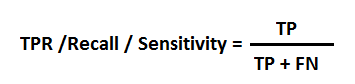
TPR (True Positive Rate) / Recall /Sensitivity :
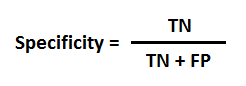
Specificity :
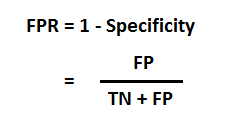
FPR (False Positive Rate) :
Sensitivity and Specificity are inversely proportional to each other. So when we increase Sensitivity, Specificity decreases and vice versa.
Sensitivity⬆️, Specificity⬇️ and Sensitivity⬇️, Specificity⬆️
Learn More
Types Of Learners In Classification :
1. Lazy Learners : Lazy learners simply store the training data and wait until a testing data appears. The classification
is done using the most related data in the stored training data. They have more predicting time compared to eager learners.
Eg – k-nearest neighbor, case-based reasoning.
2. Eager Learners : Eager learners construct a classification model based on the given training data before getting
data for predictions. It must be able to commit to a single hypothesis that will work for the entire space. Due to this,
they take a lot of time in training and less time for a prediction. Eg – Decision Tree, Naive Bayes, Artificial Neural Networks.
Learn More